- Mengapa Pendampingan Hukum Menjadi Hak Dasar
- Mengintegrasikan Genset Perkantoran dalam Ekosistem Bisnis Modern
- Memahami Berapa Lama Durasi Kegiatan Haji
- Mengapa Anda Wajib Melebihkan Belanja Keramik dan Granit
- Pentingnya Moda Transportasi Modern di Era Sekarang
- Fungsi Neon Box untuk Usaha di Pinggir Jalan
- Memilih Travel Umroh yang Amanah untuk Perjalanan Ibadah yang Tenang
- The Impact of CDN Providers in Driving Technological Growth in Indonesia
- Seperti Apa Memilih SEO Agency Indonesia yang Kredibel?
- Mengapa Website Menjadi Sarana Branding di Era Digital
Materi populer
Sepanjang waktu:
- TEKNIK PERBANYAKAN SIRIH MERAH
- HARTA AMANAH BANGSA INDONESIA
- Ramuan pupuk/pupuk daun buat tanaman cabe, tomat pada musim hujan
- CAWENE
- Membuat Paket Debian
- pupuk kandang sapi, ayam, kambing
- DZIKIR AL- KHIDIR
- Mulai Belajar java dari mana? ...
- Stock Opname di TinyERP
- Petani Cabe Wonosobo Berhasil Menekan Serangan Virus Kuning

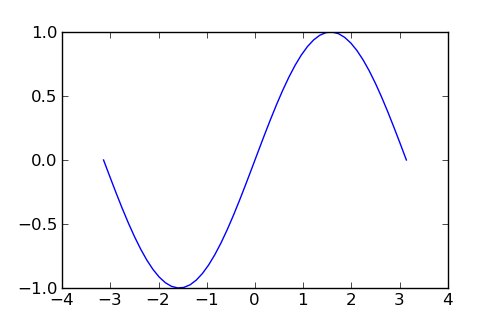
Grafik Matematika dengan Python

Sederhana saja, mari membuat grafik sinus dengan rumus y = sin(x).
Pasanglah Ubuntu 9.10 atau versi lainnya, yang penting saat apt-get berhasil.
Python sudah menjadi default di Ubuntu. Namun ada paket tambahan yang perlu disertakan untuk membuat grafik. Pastikan Anda sudah terhubung ke Internet. Gunakanlah terminal / konsole untuk menuliskan perintah ini:
$ sudo apt-get update
$ sudo apt-get install python-scientific python-matplotlib python-traitsgui
Kemudian buatlah file sinus.py berikut ini. Anda bisa gunakan kate atau gedit, keduanya sudah bisa mewarnai script Python.
import wx

import matplotlib
# We want matplotlib to use a wxPython backend
matplotlib.use('WXAgg')
from matplotlib.backends.backend_wxagg import FigureCanvasWxAgg as FigureCanvas
from matplotlib.figure import Figure
from matplotlib.backends.backend_wx import NavigationToolbar2Wx

from enthought.traits.api import Any, Instance
from enthought.traits.ui.wx.editor import Editor
from enthought.traits.ui.wx.basic_editor_factory import BasicEditorFactory

class _MPLFigureEditor(Editor):

    scrollable  = True

    def init(self, parent):
        self.control = self._create_canvas(parent)
        self.set_tooltip()

    def update_editor(self):
        pass

    def _create_canvas(self, parent):
        """ Create the MPL canvas. """
        # The panel lets us add additional controls.
        panel = wx.Panel(parent, -1, style=wx.CLIP_CHILDREN)
        sizer = wx.BoxSizer(wx.VERTICAL)
        panel.SetSizer(sizer)
        # matplotlib commands to create a canvas
        mpl_control = FigureCanvas(panel, -1, self.value)
        sizer.Add(mpl_control, 1, wx.LEFT | wx.TOP | wx.GROW)
        toolbar = NavigationToolbar2Wx(mpl_control)
        sizer.Add(toolbar, 0, wx.EXPAND)
        self.value.canvas.SetMinSize((10,10))
        return panel

class MPLFigureEditor(BasicEditorFactory):

    klass = _MPLFigureEditor


if __name__ == "__main__":
    # Create a window to demo the editor
    from enthought.traits.api import HasTraits
    from enthought.traits.ui.api import View, Item
    from numpy import sin, cos, linspace, pi

    class Test(HasTraits):

        figure = Instance(Figure, ())

        view = View(Item('figure', editor=MPLFigureEditor(),
                                show_label=False),
                        width=400,
                        height=300,
                        resizable=True)

        def __init__(self):
            super(Test, self).__init__()
            axes = self.figure.add_subplot(111)
	    x = linspace(-pi, pi)   # kumpulkan data
	    axes.plot(x, sin(x))    # y = sin(x)

    Test().configure_traits()
Lalu jalankan:
$ python sinus.py
Grafik yang dihasilkan bisa Anda simpan ke format PNG dengan klik gambar disket. Bila Anda menggunakan kate sebagai text editor, maka terminal bisa diaktifkan dibawahnya untuk memudahkan running script. Bagi yang belum memahami dasar-dasar Python bisa baca Python untuk Pemula.
Selamat mencoba.
Referensi:
| Lampiran | Ukuran |
|---|---|
| sinus.py.txt | 2.1 KB |
| sinus.png | 12.62 KB |
Komentar terbaru
12 tahun 16 pekan y.l.
14 tahun 46 pekan y.l.
14 tahun 46 pekan y.l.
14 tahun 47 pekan y.l.